 Home
Home
 Back
Back
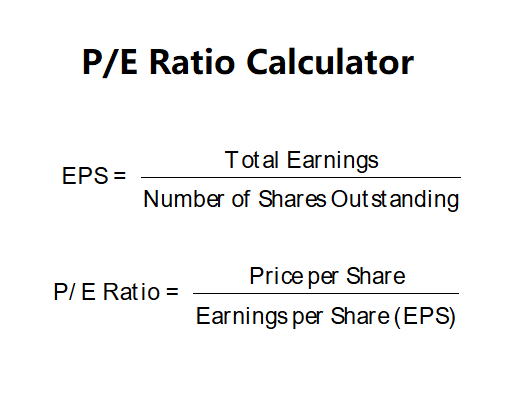
P/E Ratio Calculator computes the Price-to-Earnings (P/E) ratio, which measures a company's stock price relative to its earnings per share.
It is widely used in finance to evaluate whether a stock is overvalued or undervalued.
Input the price per share and either the earnings per share (EPS) directly or the total earnings and number of shares outstanding to calculate EPS. The calculator uses the following formulas:
Click 'Calculate' to see the P/E ratio.
Example 1 (Calculate EPS): Price per Share = $125.00, Total Earnings = $25.00, Number of Shares Outstanding = 1.1364.
Calculation: \( \text{EPS} = \frac{25.00}{1.1364} \approx 22.00 \), \( \text{P/E Ratio} = \frac{125.00}{22.00} \approx 5.682 \, \text{x} \)
Example 2 (Direct EPS): Price per Share = $50.00, Earnings per Share = $5.00.
Calculation: \( \text{P/E Ratio} = \frac{50.00}{5.00} = 10.000 \, \text{x} \)
Enter values and click 'Calculate' to verify.
1. What is the P/E ratio?
The P/E ratio is the price-to-earnings ratio, showing how much investors are willing to pay per dollar of earnings.
2. What does a high P/E ratio mean?
A high P/E ratio may indicate that the stock is overvalued or that investors expect high future growth.
3. What is a good P/E ratio?
It varies by industry, but a P/E ratio between 15 and 25 is often considered reasonable for many companies.
4. How is EPS calculated?
EPS is calculated as total earnings divided by the number of shares outstanding (\( \text{EPS} = \frac{\text{Total Earnings}}{\text{Number of Shares Outstanding}} \)).